The Law School Admissions System Challenged in Grutter
Like the undergraduate system the University of Michigan Law School system was (and is) carefully designed to achieve a predetermined racial mix of students. Indeed, the disparities between minority and non-minority acceptance rates are even greater in the law school than in any of the undergraduate systems struck down in Gratz. Had CIR client Barbara Grutter been a member of a preferred racial group, she almost certainly would have been accepted.
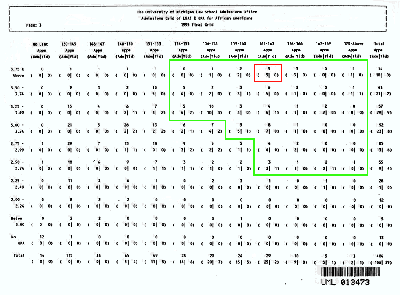
Below are grids created by the University of Michigan Law School to track applications and admissions according to race. Ranges of LSAT scores form the columns of each chart and a ranges of GPAs form the rows of each chart. The top number in each cell of the grid is the number of applications within its LSAT and GPA range, the lower-left number is the number admitted, and the lower-right number is the number who actually enrolled in the school.
The upper-right portion of the chart, where candidates with the highest grades and test scores fall, naturally contains the highest rate of admissions. For example, applicants who fell anywhere within the safety zone outlined in green on the chart below had an excellent chance of admission: typically, at least 67 percent and often as high as 100 percent. (Click on the grid below to display a larger version in a separate window.)
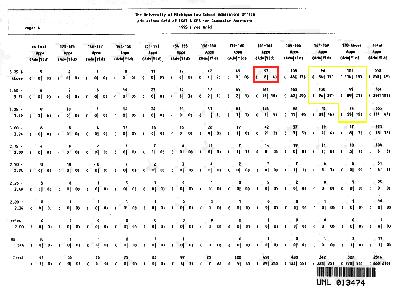
Barbara Grutter’s grades and score placed her in the cell outlined in red, which is well within the green zone. Unfortunately, the above chart only shows admissions for African-Americans. Below is an identically laid out chart showing admission rates for Caucasian applicants.
The area outlined in yellow shows the test scores and grades needed by white applicants to have the same excellent chances of admission as in the previous chart’s green area. The safety zone consists of just 5 cells, while the previous grid’s safety zone comprised 34 cells.
This time Grutter’s grades and scores show a poor chance of admission; less than 9 percent of the applicants in her cell were admitted, as compared to 100 percent in the chart for African-Americans.
Associated Pages
- Gratz v. Bollinger; Grutter v. Bollinger
- Gratz & Grutter: Who Were Gratz and Grutter?
- Gratz & Grutter: What Was the Dispute?
- Gratz & Grutter: Undergrad Preferences
- Gratz & Grutter: Law School Preferences
- Gratz & Grutter: The Rulings
- Gratz & Grutter: Consequences and Commentary
- Gratz & Grutter: Michigan Civil Rights Initiative
- Gratz & Grutter: Chronology
- Gratz & Grutter: Frequently Asked Questions
- Gratz & Grutter: Further Reading on the Michigan Cases


